การ Scale ข้อมูลใน Machine Learning ด้วย Python
การ Scale ข้อมูลใน Machine Learning คือการปรับค่าของแต่ละ feature ให้มีค่าอยู่ในช่วงเดียวกันหรือประมาณกัน เพื่อให้โมเดลสามารถเรียนรู้และทำนายผลได้ดีขึ้น โดยทั่วไปแล้ว Scale จะใช้กับข้อมูลที่มีค่าต่างกันมากๆ เช่น ข้อมูลที่มีหน่วยวัดต่างกัน เช่น น้ำหนัก (kg), ความยาว (cm), อุณหภูมิ (Celsius) เป็นต้น
การ Scale ข้อมูลทำได้หลายวิธี แต่วิธีที่ใช้บ่อยที่สุด คือ
1. Standardization
เป็นการปรับค่าของ feature โดยให้มี mean เท่ากับ 0 และ standard deviation เท่ากับ 1 โดยใช้สูตรดังนี้
z = (x – mean) / std
โดยที่
- x = ค่าของ feature ในแต่ละตัวอย่าง
- mean = ค่าเฉลี่ยของ feature
- std = ส่วนเบี่ยงเบนมาตรฐานของ feature
2. Min-Max Scaling
เป็นการปรับค่าของ feature ให้มีค่าอยู่ระหว่าง 0 ถึง 1 โดยใช้สูตรดังนี้
x_scaled = (x – min) / (max – min)
โดยที่
- x = ค่าของ feature ในแต่ละตัวอย่าง
- min = ค่าของ feature ที่น้อยที่สุด
- max = ค่าของ feature ที่มากที่สุด
การเลือกวิธี Scale ข้อมูลขึ้นอยู่กับลักษณะของข้อมูลและประเภทของโมเดลที่ใช้ ในบางกรณี Standardization จะให้ผลลัพธ์ที่ดีกว่า Min-Max Scaling แต่ในบางกรณีอาจจะต้องใช้ Min-Max Scaling แทน เช่น การใช้ Neural Network สำหรับการแยกแยะภาพ เป็นต้น
การ Scale ข้อมูล มีประโยชน์ดังนี้ คือ
-
ช่วยให้โมเดลมีประสิทธิภาพมากขึ้น การ Scale ข้อมูลช่วยปรับค่าของ feature ให้มีค่าที่เหมาะสมและเทียบเท่ากัน ทำให้โมเดลสามารถทำงานได้ดีขึ้นและมีประสิทธิภาพมากขึ้น
-
ช่วยลดเวลาการ Train โมเดล การ Scale ข้อมูลช่วยลดความซับซ้อนของโมเดลและลดเวลาในการ Train โมเดลเพราะโมเดลจะมีการประมวลผลที่ซับซ้อนมากขึ้นหากมี feature ที่มีช่วงค่าต่างกันมากๆ
-
ช่วยให้โมเดลทำนายได้แม่นยำกว่า การ Scale ข้อมูลช่วยปรับค่าของ feature เพื่อให้มีค่าในช่วงที่เหมาะสมและเทียบเท่ากัน ทำให้โมเดลสามารถทำนายผลได้แม่นยำมากขึ้น และลดความผิดพลาดในการทำนาย
-
ช่วยให้โมเดลสามารถ generalization ได้ดีขึ้น การ Scale ข้อมูลช่วยลดความซับซ้อนของโมเดลและช่วยให้โมเดล generalization ได้ดีขึ้น หรือสามารถทำนายผลในข้อมูลที่ไม่เคยเห็นมาก่อนได้ดีขึ้น
การ Scale ข้อมูลใน Machine Learning ด้วย Python มีขั้นตอนดังนี้
- Import module ที่ต้องการใช้งาน เช่น sklearn.preprocessing, pandas เป็นต้น
- โหลดข้อมูลเข้ามาจากแหล่งข้อมูลต่างๆ เช่น csv file, database, หรือ API แล้วเก็บไว้ใน DataFrame ของ pandas
- กำหนด feature ที่ต้องการ Scale โดยใช้คำสั่ง
- สร้าง object ของ StandardScaler จาก sklearn.preprocessing แล้ว Scale feature ที่ต้องการ
- ตรวจสอบว่า Scale ถูกต้องหรือไม่ โดยใช้คำสั่ง
- นำ DataFrame ที่ Scale แล้วไปใช้ Train โมเดล Machine Learning ต่อไป
ตัวอย่าง การ Scale ข้อมูลใน Machine Learning ด้วย Python ด้วย module sklearn.preprocessing และ pandas
from sklearn.preprocessing import StandardScaler
import pandas as pd
import matplotlib.pyplot as plt

# โหลดข้อมูล และเก็บไว้ใน DataFrame
data = {'feature1': [10, 20, 30, 40, 50],
'feature2': [100, 200, 300, 400, 500],
'feature3': [1000, 2000, 3000, 4000, 5000],
'label': [1, 0, 1, 0, 1]}
df = pd.DataFrame(data)

# กำหนด feature ที่ต้องการ Scale
features_to_scale = ['feature1', 'feature2', 'feature3']

# Scale feature ที่ต้องการด้วย StandardScaler จาก sklearn.preprocessing
scaler = StandardScaler()
df[features_to_scale] = scaler.fit_transform(df[features_to_scale])

# ตรวจสอบค่าเฉลี่ย ส่วนเบี่ยงเบนมาตรฐาน ของ feature ที่ Scale แล้ว
print(df.describe())

# นำ DataFrame ที่ Scale แล้วไปใช้ Train โมเดล Machine Learning ต่อไป

# พล็อตกราฟ feature ก่อน Scale
plt.subplot(1, 2, 1)
plt.scatter(data['feature1'], data['label'])
plt.scatter(data['feature2'], data['label'])
plt.scatter(data['feature3'], data['label'])
plt.xlabel('Features')
plt.ylabel('Label')
plt.title('Before Scaling')

# พล็อตกราฟ feature หลัง Scale
plt.subplot(1, 2, 2)
plt.scatter(df['feature1'], df['label'])
plt.scatter(df['feature2'], df['label'])
plt.scatter(df['feature3'], df['label'])
plt.xlabel('Features')
plt.ylabel('Label')
plt.title('After Scaling')

plt.show()
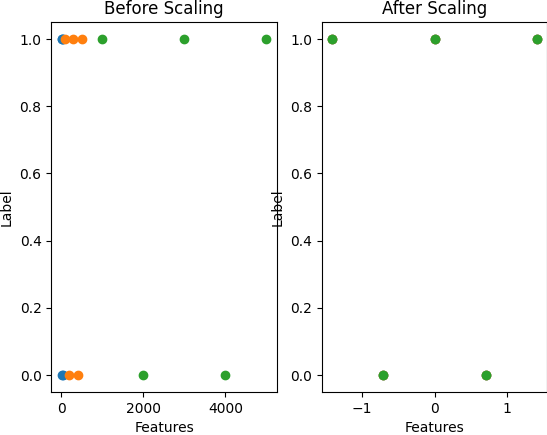
ผลลัพธ์ที่ได้ คือ
       feature1  feature2  feature3     label
count  5.000000  5.000000  5.000000  5.000000
mean   0.000000  0.000000  0.000000  0.600000
std    1.118034  1.118034  1.118034  0.547723
min   -1.414214 -1.414214 -1.414214  0.000000
25%   -0.707107 -0.707107 -0.707107  0.000000
50%    0.000000  0.000000  0.000000  1.000000
75%    0.707107  0.707107  0.707107  1.000000
max    1.414214  1.414214  1.414214  1.000000
ตัวอย่าง การ Scale ข้อมูลใน Machine Learning ด้วย Python จะใช้ชุดข้อมูล iris dataset ที่เป็นชุดข้อมูลเกี่ยวกับดอกไม้ที่มีการใช้งานอย่างแพร่หลายใน Machine Learning โดยใช้วิธีการ Scale ด้วย StandardScaler จาก sklearn.preprocessing
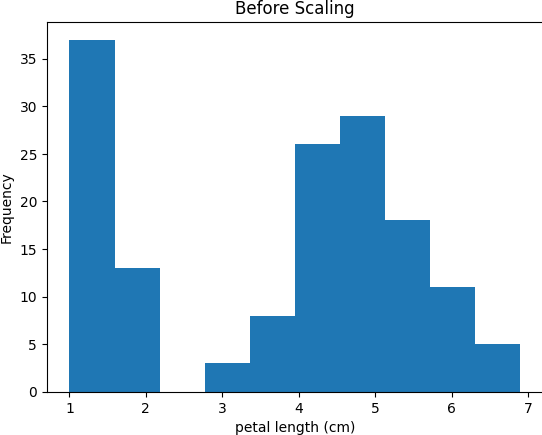
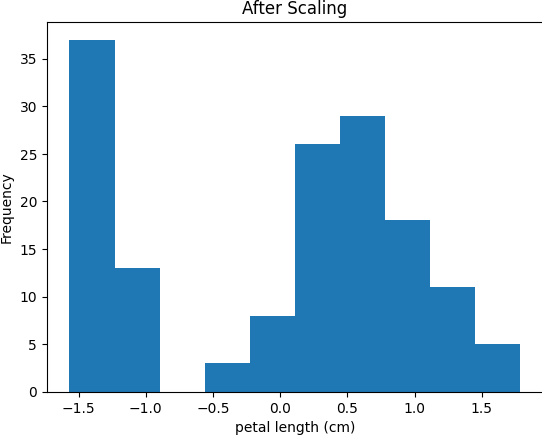
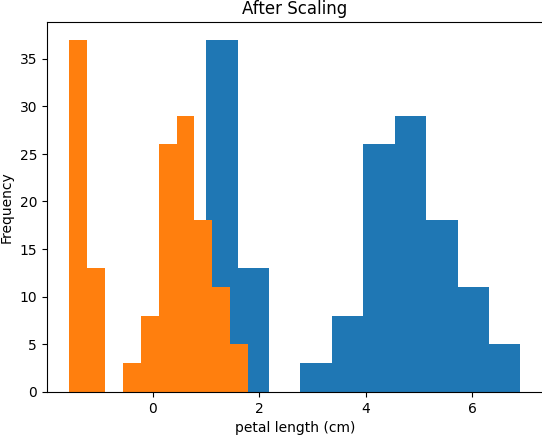
การ Scale ข้อมูลของ iris dataset ด้วย StandardScaler และแสดงผลลัพธ์เปรียบเทียบกับข้อมูลก่อน Scale โดยใช้กราฟ histogram
from sklearn.datasets import load_iris
from sklearn.preprocessing import StandardScaler
import pandas as pd
import matplotlib.pyplot as plt

# โหลด iris dataset และเก็บไว้ใน DataFrame
iris = load_iris()
iris_df = pd.DataFrame(data=iris.data, columns=iris.feature_names)
iris_df['target'] = iris.target

# แสดง histogram ของ feature 'petal length (cm)' ก่อน Scale
plt.hist(iris_df['petal length (cm)'])
plt.title('Before Scaling')
plt.xlabel('petal length (cm)')
plt.ylabel('Frequency')
plt.show()

# Scale ด้วย StandardScaler จาก sklearn.preprocessing
scaler = StandardScaler()
iris_df[iris.feature_names] = scaler.fit_transform(iris_df[iris.feature_names])

# แสดง histogram ของ feature 'petal length (cm)' หลัง Scale
plt.hist(iris_df['petal length (cm)'])
plt.title('After Scaling')
plt.xlabel('petal length (cm)')
plt.ylabel('Frequency')
plt.show()

# ตรวจสอบค่าเฉลี่ย ส่วนเบี่ยงเบนมาตรฐาน ของ feature ที่ Scale แล้ว
print(iris_df.describe())
ผลลัพธ์ที่ได้คือกราฟ histogram ของ feature ‘petal length (cm)’ ก่อนและหลัง Scale ด้วย StandardScaler ดังนี้


       sepal length (cm)  sepal width (cm)  ...  petal width (cm)      target
count       1.500000e+02      1.500000e+02  ...      1.500000e+02  150.000000
mean       -1.468455e-15     -1.823726e-15  ...     -9.473903e-16    1.000000
std         1.003350e+00      1.003350e+00  ...      1.003350e+00    0.819232
min        -1.870024e+00     -2.433947e+00  ...     -1.447076e+00    0.000000
25%        -9.006812e-01     -5.923730e-01  ...     -1.183812e+00    0.000000
50%        -5.250608e-02     -1.319795e-01  ...      1.325097e-01    1.000000
75%         6.745011e-01      5.586108e-01  ...      7.906707e-01    2.000000
max         2.492019e+00      3.090775e+00  ...      1.712096e+00    2.000000

[8 rows x 5 columns]
